Your RGB LED TV questions, answered.
Company News
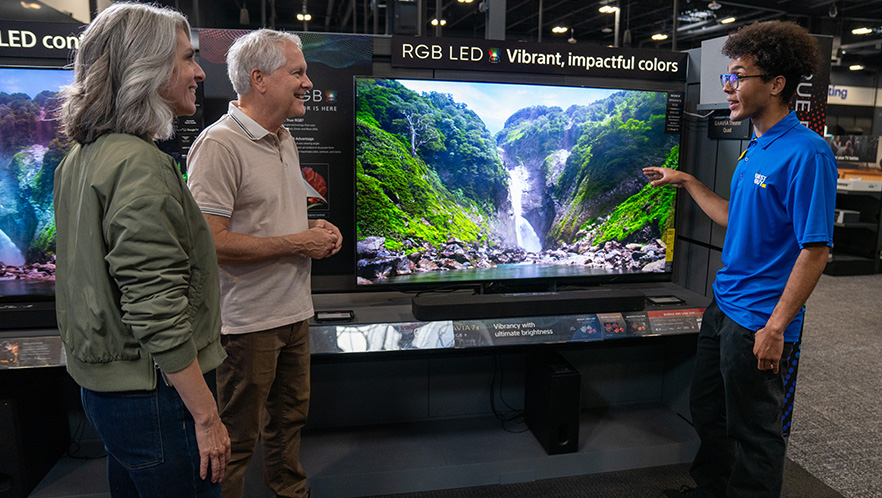
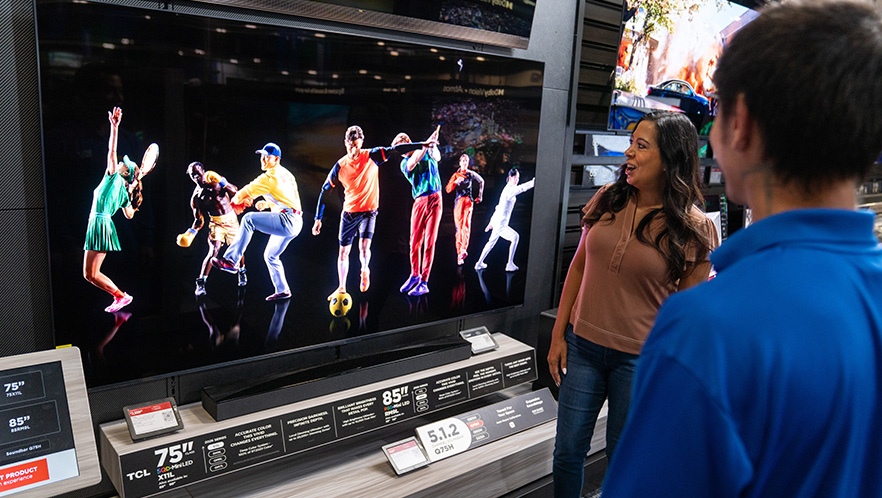
As the exclusive national retailer, Best Buy brings next-generation TV technology from Samsung, Sony, LG, TCL and Hisense to all stores.
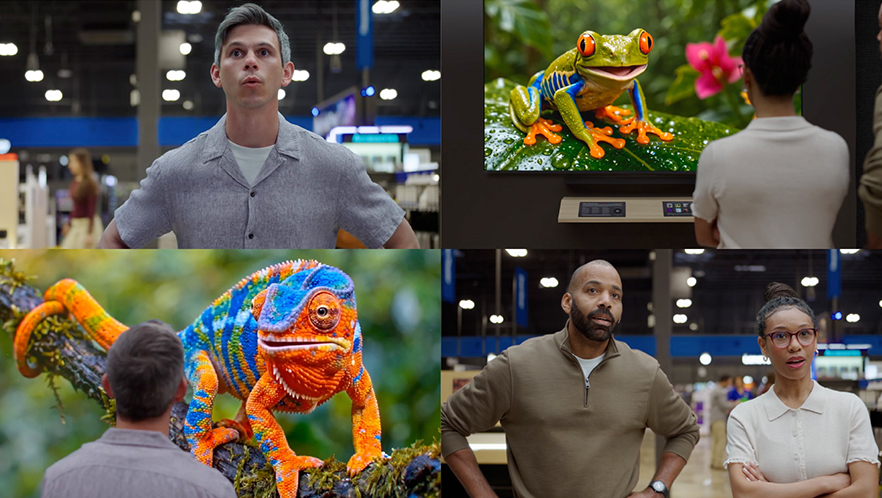
RGB LED TVs deliver a major leap forward in lifelike color and brightness.

At the conclusion of the program, interns interested in continuing with Best Buy may be considered for part-time, seasonal or full-time roles,
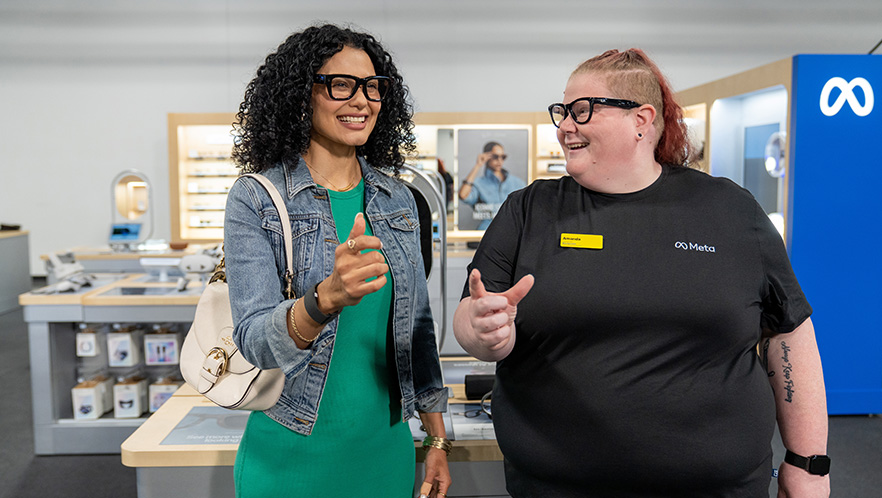
Customers can learn more, get personalized fittings, plus try on the largest assortment across big-box retail.

All Best Buy stores have dedicated Oura displays, so shoppers can experience the new tech, various colors and get sized for themselves.
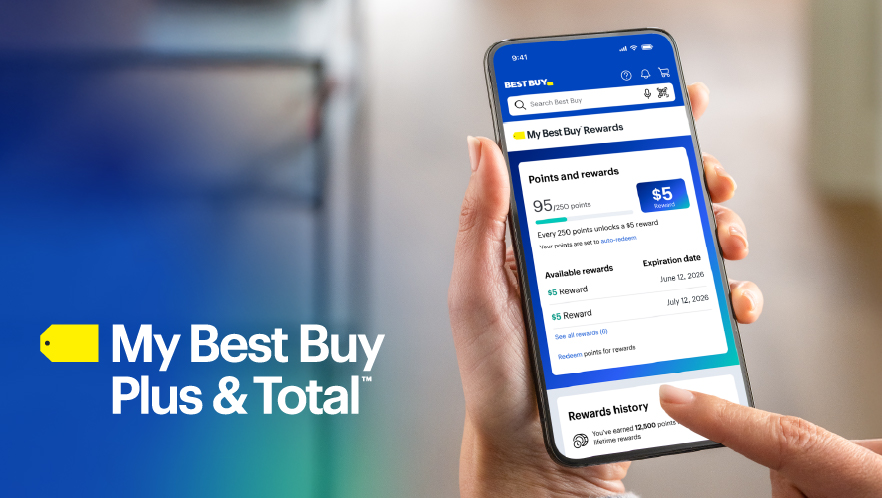
Points are in addition to the benefits members enjoy today, like exclusive deals, 24/7 tech support, free two-day shipping and more.

For more than 18 years, Geek Squad Academy has empowered young people to build skills through access to technology that they can apply both in school and in tech-enabled careers of the future.

Best Buy Co., Inc. (NYSE: BBY) today announced results for the 13-week first quarter ended May 2, 2026.

Jason Bonfig to succeed Corie Barry as Chief Executive Officer, following her planned departure at the end of Q3

Through a network of Best Buy Teen Tech Centers® and community partnerships, the Foundation helps young people develop critical career skills and gain real-world experience to thrive in tech-reliant careers of the future.

Each year, CDP assesses companies worldwide on transparency, risk management and environmental leadership.