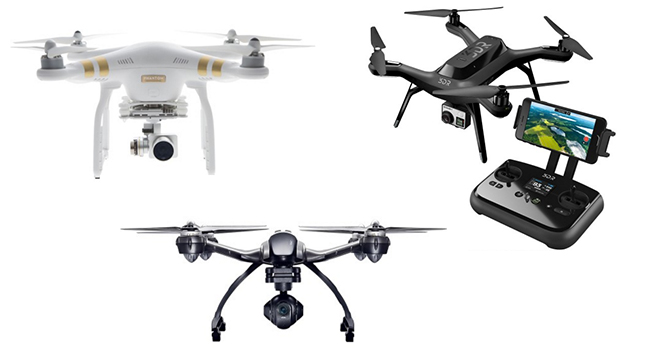
Drones are generating a lot of buzz as one of this year’s hottest — and most talked about — holiday gifts for first-time fliers and avid aviators alike. Best Buy is the place to go for product selection and education.
Company News
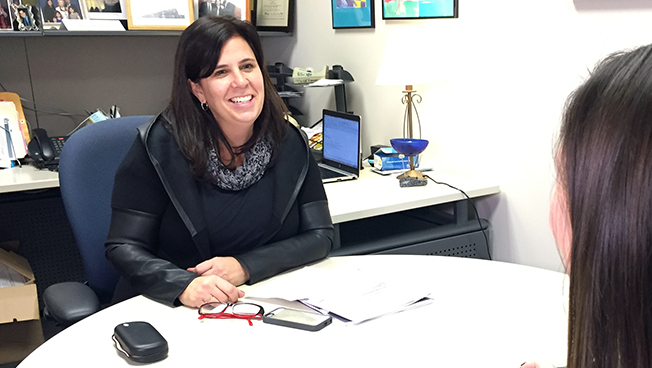
While the holiday shopping season is in full-swing here in the U.S., there’s another crowd gathering in Paris for the global conference on climate change, also referred to as COP21. Best Buy’s Laura Bishop, vice president of Public Affairs & Sustainability, is there to represent our sustainability efforts.

Need help choosing between two TVs? Want to check the status of a recent order? Now you can get help that and more with BlueAssist, a new live-chat feature within the Best Buy mobile app.

Sometimes important data — from baby pictures to family videos to term papers — seems to go missing from your device. Before you panic, though, consider bringing it in to a Best Buy store for help.
![BestBuyiPad_Home[1]](https://corporate.bestbuy.com/wp-content/uploads/2015/11/BestBuyiPad_Home1-thegem-blog-default-large.png)
We’re making it easier than ever for you to use your iPad to shop for the hottest tech products this Holiday season. We’ve launched an enhanced app designed to be faster and easier for tablet use.
Domestic Segment Revenue Increased 1.2%
Non-GAAP Diluted EPS from Continuing Operations Increased 21% to $0.41
GAAP Diluted EPS from Continuing Operations Increased 12% to $0.37
MINNEAPOLIS, Nov. 19, 2015 — Best Buy Co., Inc. (NYSE: BBY) today announced results for the third quarter (“Q3 FY16”) ended October 31, 2015 as compared to the third quarter (“Q3 FY15”) ended November 1, 2014.
Printable PDF version: Click here
| Q3 FY16 | Q3 FY15 | |
| Enterprise Revenue ($ in millions)1 | $8,819 | $9,032 |
| Domestic segment | $8,090 | $7,992 |
| International segment1 | $729 | $1,040 |
| Enterprise Comparable Sales % Change: | ||
| Excluding the estimated benefit of installment billing2,3 | 0.5% | 2.2%4 |
| Estimated benefit of installment billing3 | 0.3% | 0.7% |
| Comparable sales % change2 | 0.8% | 2.9%4 |
| Domestic Comparable Sales % Change: | ||
| Excluding the estimated benefit of installment billing2,3 | 0.5% | 2.4% |
| Estimated benefit of installment billing3 | 0.3% | 0.8% |
| Comparable sales % change2 | 0.8% | 3.2% |
| Comparable online sales % change2 | 18.3% | 21.6% |
| Q3 FY16 | Q3 FY15 | |
| Operating Income: | ||
| GAAP operating income as a % of revenue | 2.6% | 2.3% |
| Non-GAAP operating income as a % of revenue5 | 2.8% | 2.4% |
| Diluted Earnings per Share (EPS): | ||
| GAAP diluted EPS from continuing operations | $0.37 | $0.33 |
| Impact of non-restructuring SG&A charges6 | $0.02 | $0.02 |
| Impact of restructuring charges6 | $0.02 | $0.01 |
| Impact of gain on investments, net | $0.00 | ($0.01) |
| Income tax impact of Non-GAAP adjustments7 | $0.00 | ($0.01) |
| Non-GAAP diluted EPS from continuing operations5 | $0.41 | $0.34 |
Hubert Joly, Best Buy chairman and CEO, commented, “We have delivered another quarter of Domestic comparable sales growth and operating income expansion.
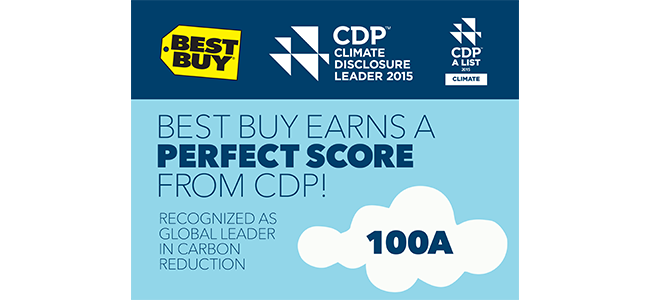
CDP released its S&P 500 Annual Report, including the Carbon Disclosure Leadership Index, in which Best Buy received the maximum score of 100. Adding to our “A” designation for our carbon reduction program, Best Buy achieved a perfect score.
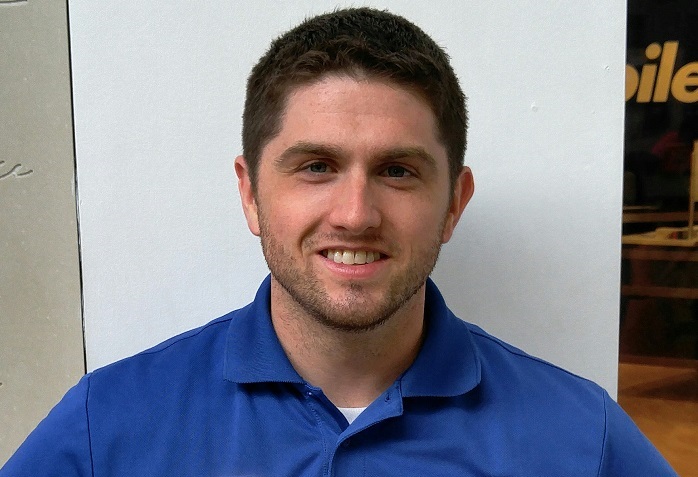
When U.S. Army Reserve Sergeant Victor Hill returned from a deployment in Afghanistan, he struggled to find a job. Many prospective employers thanked him for his military service, but they disqualified him because of his lack of civilian qualifications.
Then he landed a job as a seasonal employee at his local Best Buy Mobile, a move that would pave the way for a bright future. Three years later, he’s now the general manager at Best Buy Mobile Store #1931 in Annapolis, Maryland, where he’s leading a team of a dozen people this Holiday season.
Nearly 500 employees spent part of last Friday filling care packages with snacks, speakers and drawings in an effort to lift the spirits of the men and women serving abroad who aren’t able to be home with friends and family during the holiday season.
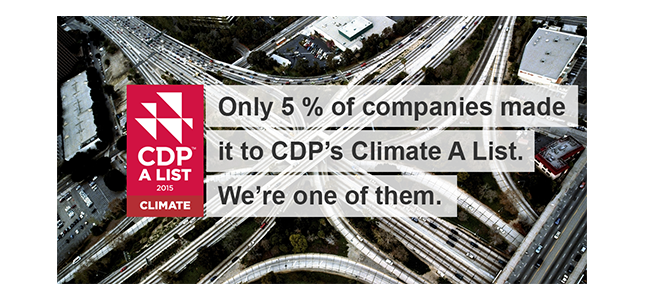
Best Buy has been awarded a prized position on the CDP Climate A List for our efforts to reduce carbon emissions in the past year.
The commendation puts Best Buy in the top 5 percent of thousands of companies that submit annual emissions data and climate management strategies to CDP (formerly Carbon Disclosure Project).
We are in good company. Other corporate “A Listers” now include sustainability powerhouses and partners such as Apple, Google, LG, Microsoft, Samsung, Sony and Sprint.
The A List designation comes shortly after Best Buy set a new goal to reduce carbon emissions by 45 percent by 2020 and signed the American Business Act Pledge on Climate Change.

State and local officials joined Best Buy in celebrating the grand opening of the company’s new technology development center in Seattle on Thursday. The office, first announced in February, is focused on mobile development, cloud engineering and the omnichannel customer experience.

With the St. Jude Thanks and Giving® campaign underway now at Best Buy, the company continues its partnership in helping St. Jude find cures for children fighting cancer by accepting donations at more than 1,400 Best Buy store locations and on BestBuy.com.