Learn how to pull off these high-tech tricks for a high-scare Halloween.
Company News
It’s a partnership as Midwestern in its roots as hot dish and hockey skates.
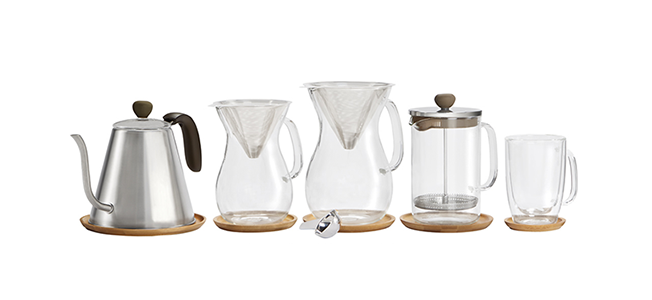
Best Buy and Caribou Coffee have partnered to bring the great taste of Caribou Coffee right into your home with an exclusive line of home brewing equipment. You can choose from a variety of brewing and drinking options that combine the Caribou coffeeshop experience with the quality of Best Buy’s Insignia brand.
The set includes an 8-cup and 6-cup pour-over coffee maker, a 2.5-cup French Press, as well as clear double-wall mugs and a stainless kettle.
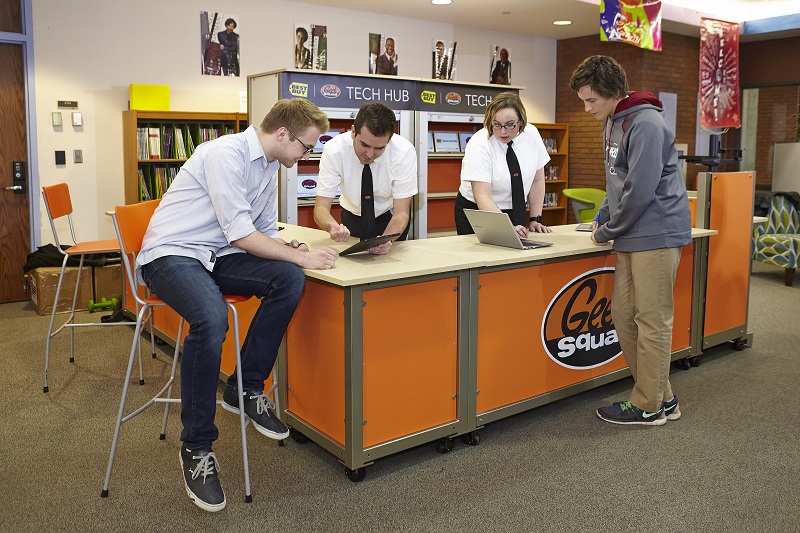
The first-ever Geek Squad Technology Hub will be staffed during the week by an Agent who will analyze tech device problems and educate teachers and students about technology.
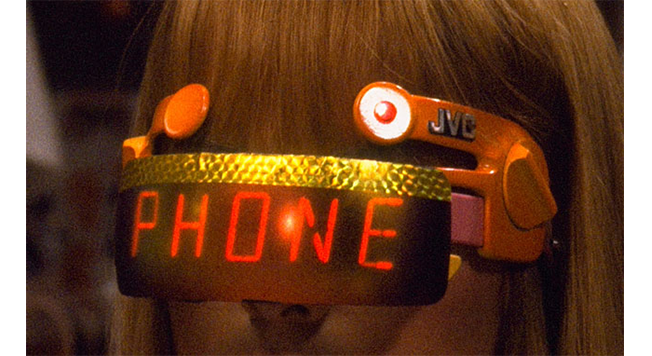
The movie Back to the Future Part II sent Marty McFly, his girlfriend Jennifer and Doc Brown from 1985 to October 21, 2015. Now that their fictional future has arrived, let’s see which promised technology predictions came true. And a few that didn’t.
Zip up your auto-fit, self-drying jacket… The future is here.
HOVERBOARD

Unfortunately, hoverboards don’t actually exist… yet. But for tech that’s cool and floats like Marty’s levitating skateboard deck, check out drones. From small toys that roll across the floor, to quadcopters complete with gimbal-mounted 4K cameras and GPS, drones are here and getting better all the time.
Today we are proud that Best Buy is joining other leading U.S. companies in signing the American Business Act Pledge on Climate Change.
This is an historic moment for Best Buy. In our pledge, we committed to further advancing our efforts toward addressing this global challenge. Here’s what we said:
- We will reduce our own carbon emissions by 45 percent by 2020 from operational reductions and renewable sourcing. This science-based goal builds on our 2014 achievement of a 26 percent reduction in carbon emissions within our operations.

Autumn is a great time of year to take great pictures, and Best Buy photography experts have some easy tips to make you a pro, no matter what kind of camera you use.
There’s nothing like the feeling of a brand new smartphone with the newest technology at your fingertips (not to mention the bragging rights) – and the feeling is even better if you can get some money back for the outdated one.
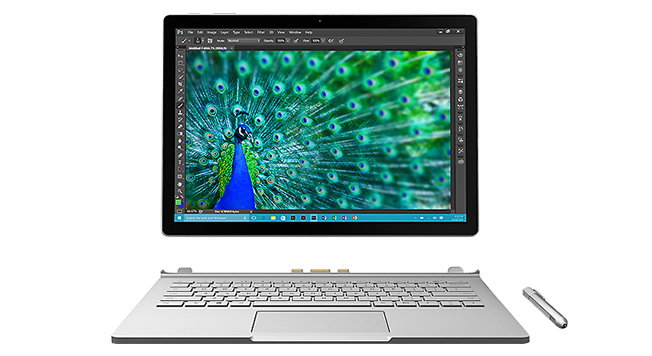
The Surface Book is a powerful new laptop. The Surface Pro 4 tablet is the thinnest and fastest Surface Pro yet. The Band 2 is Microsoft’s latest wearable device.
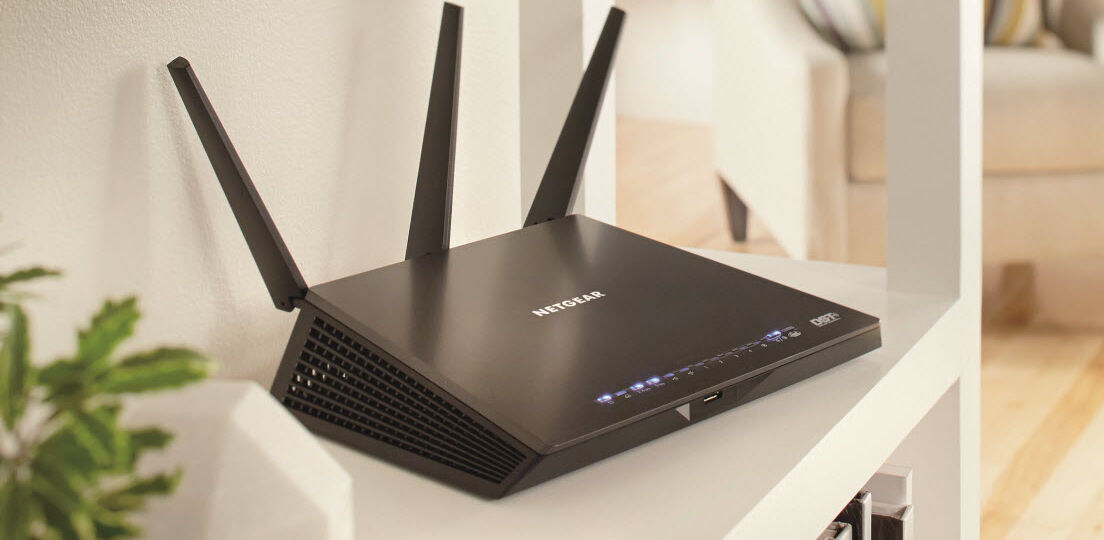
The high-performance router can keep up with the growing number of connected devices in the home, while also virtually eliminating Wi-Fi dead zones. Purchase includes remote Geek Squad setup and one year of unlimited Geek Squad support, as well as a six-month security software package.
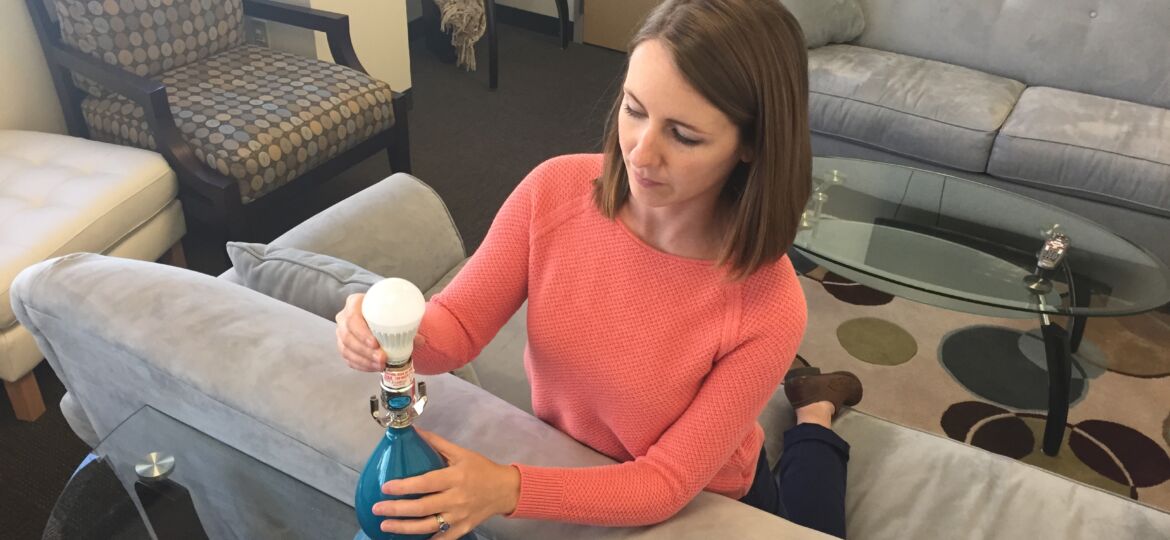
Not only is saving energy good for the environment, it’s also good for your pocketbook. Here are some little things you can do during Energy Awareness Month.
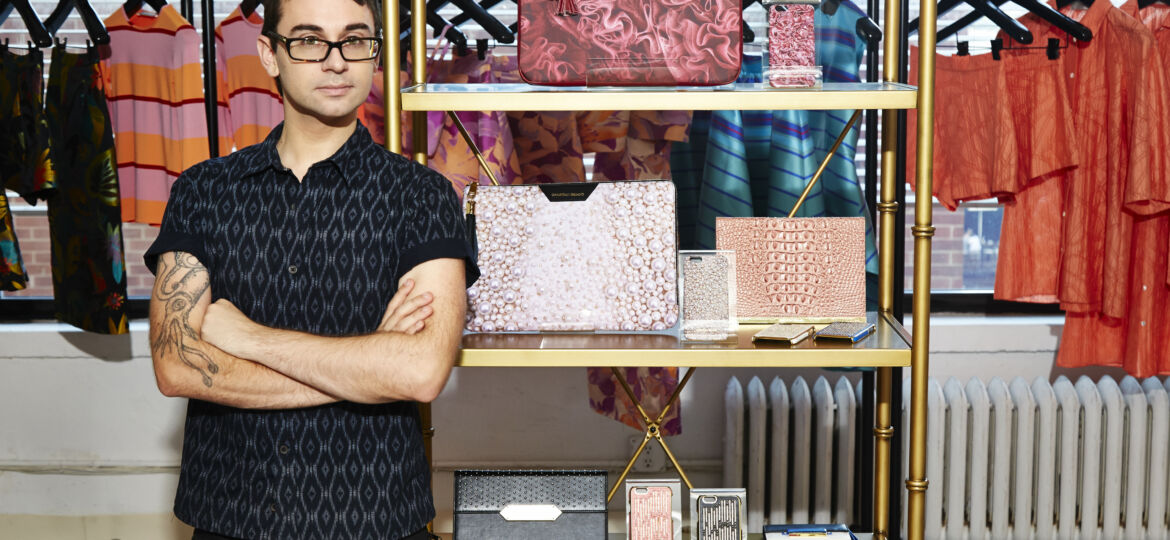
Photo courtesy of Hao Zeng
A few weeks ago, I announced my new collection of accessories for smartphones, tablets and laptops exclusively for Best Buy. I’m excited to share they have now arrived in stores!
So how did this partnership come to be? No one knows technology and the accessories you need for it like Best Buy, and I know how tricky it can be to find accessories that are both fashionable and functional. So it made sense for us to collaborate.
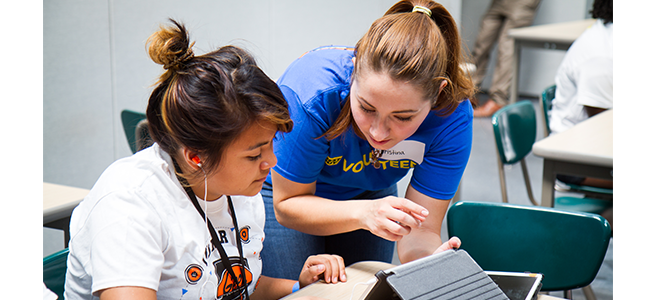
The goal was bridging the digital gap for families, but the theme was empowerment at Dorsey High School in Los Angeles on Sept. 19.
Several families, with help from Best Buy employees, were trained on basic computer skills and went home with something they didn’t have before – Internet connectivity and a computer.
Best Buy partnered with OurCycle LA, a City of Los Angeles digital inclusion pilot program geared at providing free refurbished computers and training to low-income families in Los Angeles.