

March 22 is World Water Day, and to celebrate, we’re sharing some of Best Buy’s latest efforts to reduce our impact on the planet and its water sources.
Company News
We strive to create a more sustainable world, because our customers and employees expect it and the planet demands it.

At Best Buy, we’re committed to reducing our impact on the planet.
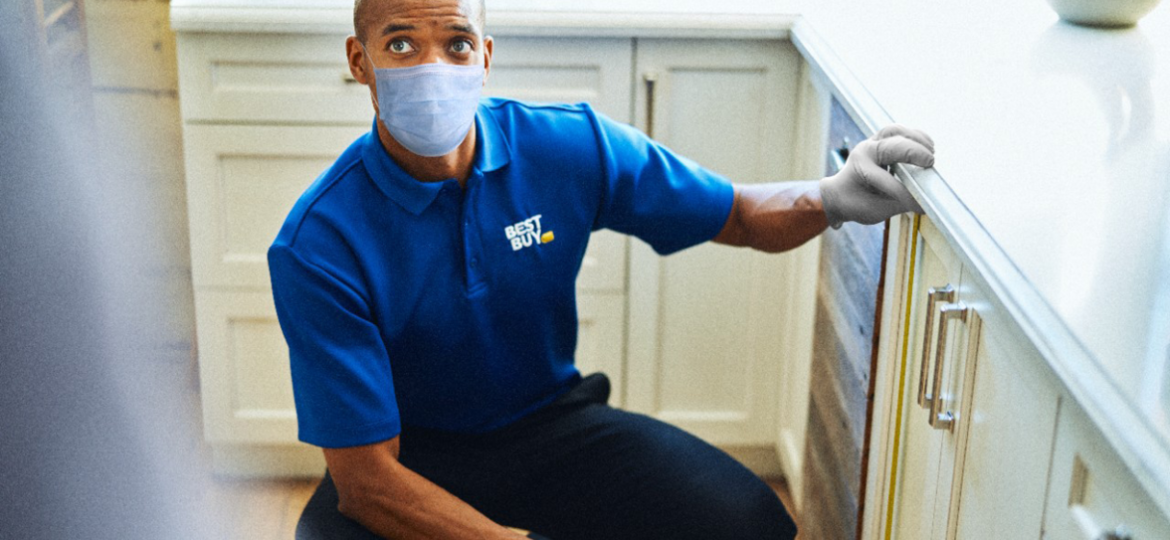
Starting in April, our Home Experts will be able to provide free eco home consultations.
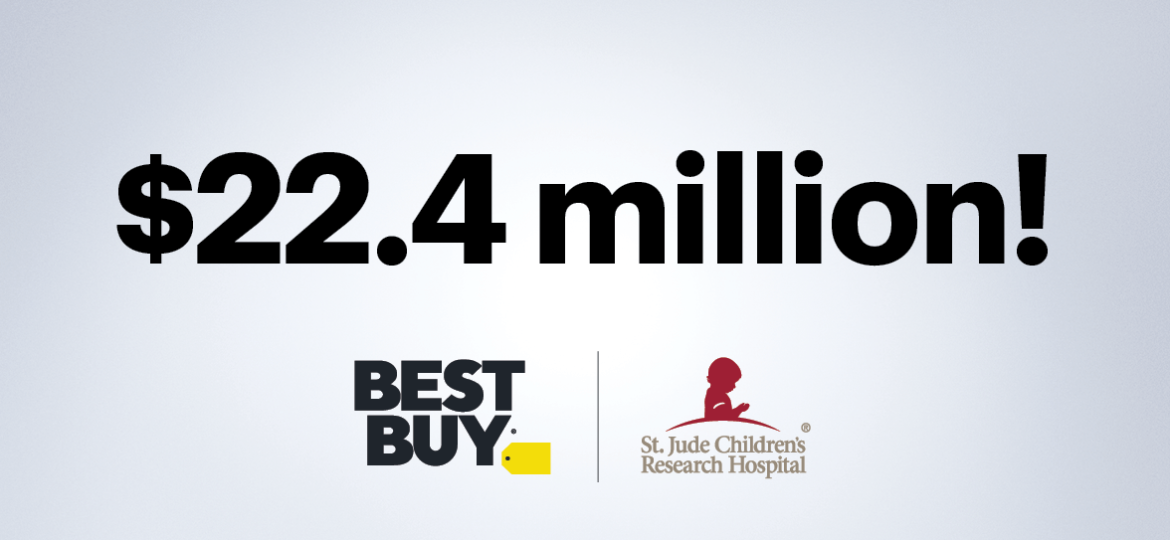
We have collected more than $125 million in donations since 2013.

She talked more about her role as chief customer officer and how Best Buy is keeping up with changing customer demands.

The 29 organizations selected are focused on enhancing digital learning for K-12 students who are Black, Indigenous or people of color.

We’re proud to be recognized by Ethisphere as one of World’s Most Ethical Companies for the seventh time.

He is the chairman, president and CEO of VF Corp., one of the world’s largest apparel, footwear and accessories companies.
Sustainability has been at the core of what we do at Best Buy for decades, and now we’re making our biggest commitment yet to positively impact the planet.
Today, we announced we have signed The Climate Pledge, a commitment to be carbon neutral across our business by 2040 — a decade faster than our previous goal of 2050.
The Climate Pledge was co-founded by Amazon and Global Optimism in 2019 to mobilize companies across multiple business sectors to reach net-zero carbon emissions by 2040, 10 years ahead of the United Nations’ Paris Agreement on Climate Change.

Enterprise Comparable Sales Increased 12.6%
Domestic Comparable Online Sales Increased 89.3%
GAAP Diluted EPS Increased 9% to $3.10
Non-GAAP Diluted EPS Increased 20% to $3.48
Quarterly Dividend Increased 27% to $0.70 per Share
MINNEAPOLIS, February 25, 2021 — Best Buy Co., Inc. (NYSE: BBY) today announced results for the 13-week fourth quarter ended January 30, 2021 (“Q4 FY21”), as compared to the 13-week fourth quarter ended February 1, 2020 (“Q4 FY20”).
(Click here to view full release and statements.)
| Revenue ($ in millions) | Q4 FY21 | Q4 FY20 | FY21 | FY20 |
| Enterprise | $16,937 | $15,196 | $47,262 | $43,638 |
| Domestic segment | $15,400 | $13,848 | $43,293 | $40,114 |
| International segment | $1,537 | $1,348 | $3,969 | $3,524 |
| Enterprise comparable sales % change1 | 12.6% | 3.2% | 9.7% | 2.1% |
| Domestic comparable sales % change1 | 12.4% | 3.4% | 9.2% | 2.3% |
| Domestic comparable online sales % change1 | 89.3% | 18.7% | 144.4% | 17.0% |
| International comparable sales % change1 | 14.9% | 1.6% | 15.0% | (0.5)% |
| Operating Income | ||||
| GAAP operating income as a % of revenue | 6.1% | 6.4% | 5.1% | 4.6% |
| Non-GAAP operating income as a % of revenue | 6.9% | 6.5% | 5.8% | 4.9% |
| Diluted Earnings per Share (“EPS”) | ||||
| GAAP diluted EPS | $3.10 | $2.84 | $6.84 | $5.75 |
| Non-GAAP diluted EPS | $3.48 | $2.90 | $7.91 | $6.07 |
For GAAP to non-GAAP reconciliations of the measures referred to in the above table, please refer to the attached supporting schedule.

We're proud to rank No. 1 on this prestigious list for the second time.